File Loader
Status:
Usages
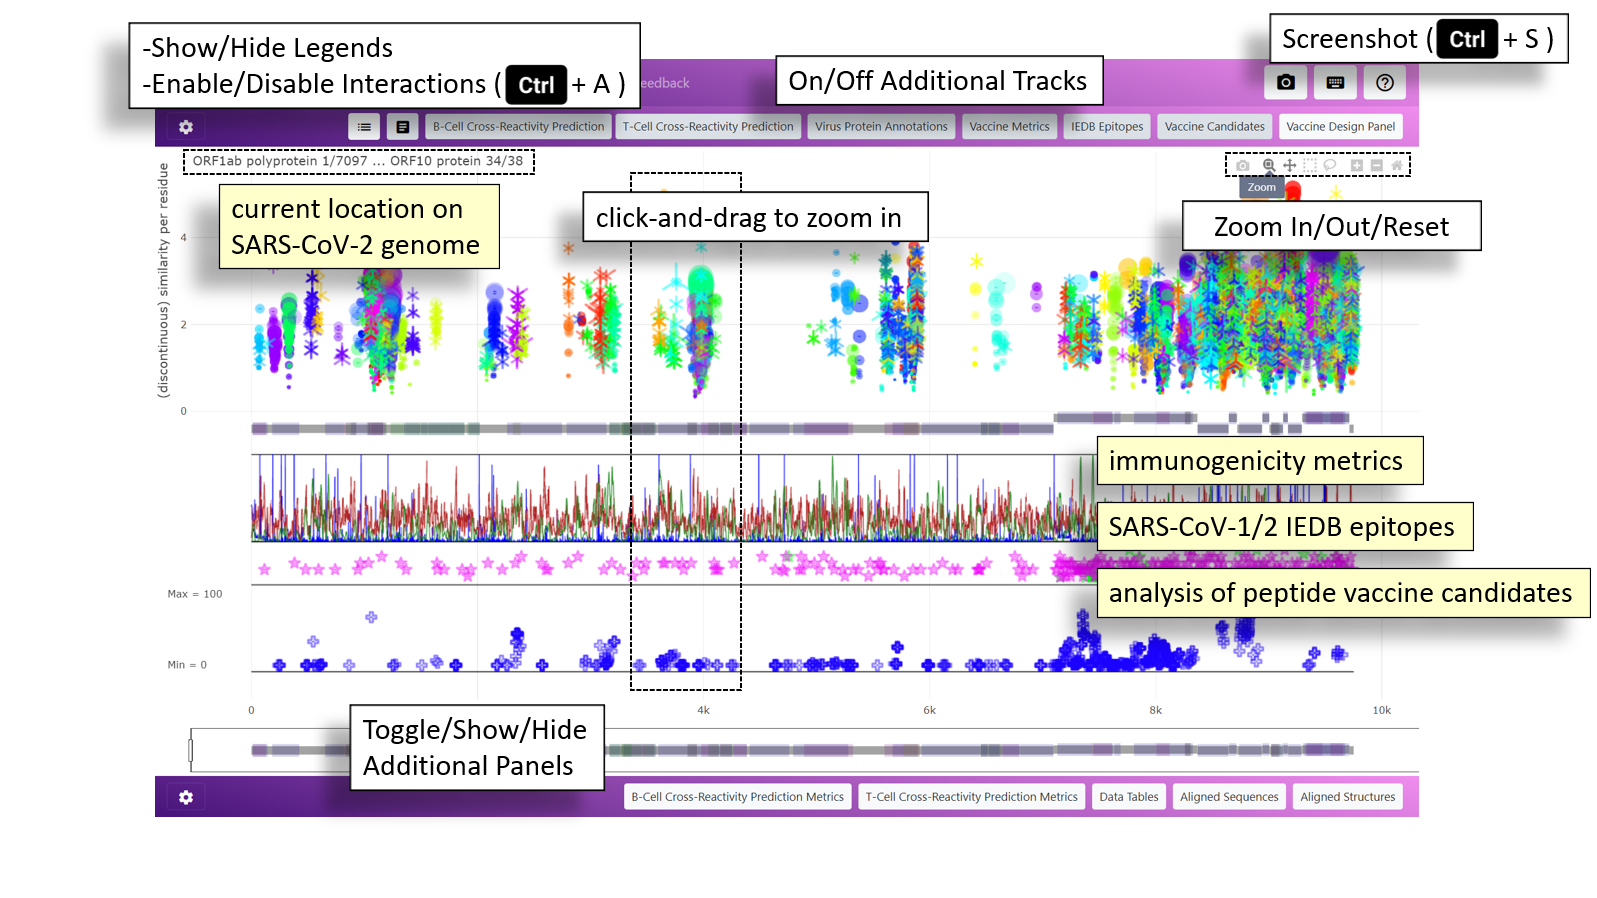
Explore cross-reactive immune epitopes
Toggle help messages by pressing Cmd + H
Keyboard shorcuts can be found at the upper right corner
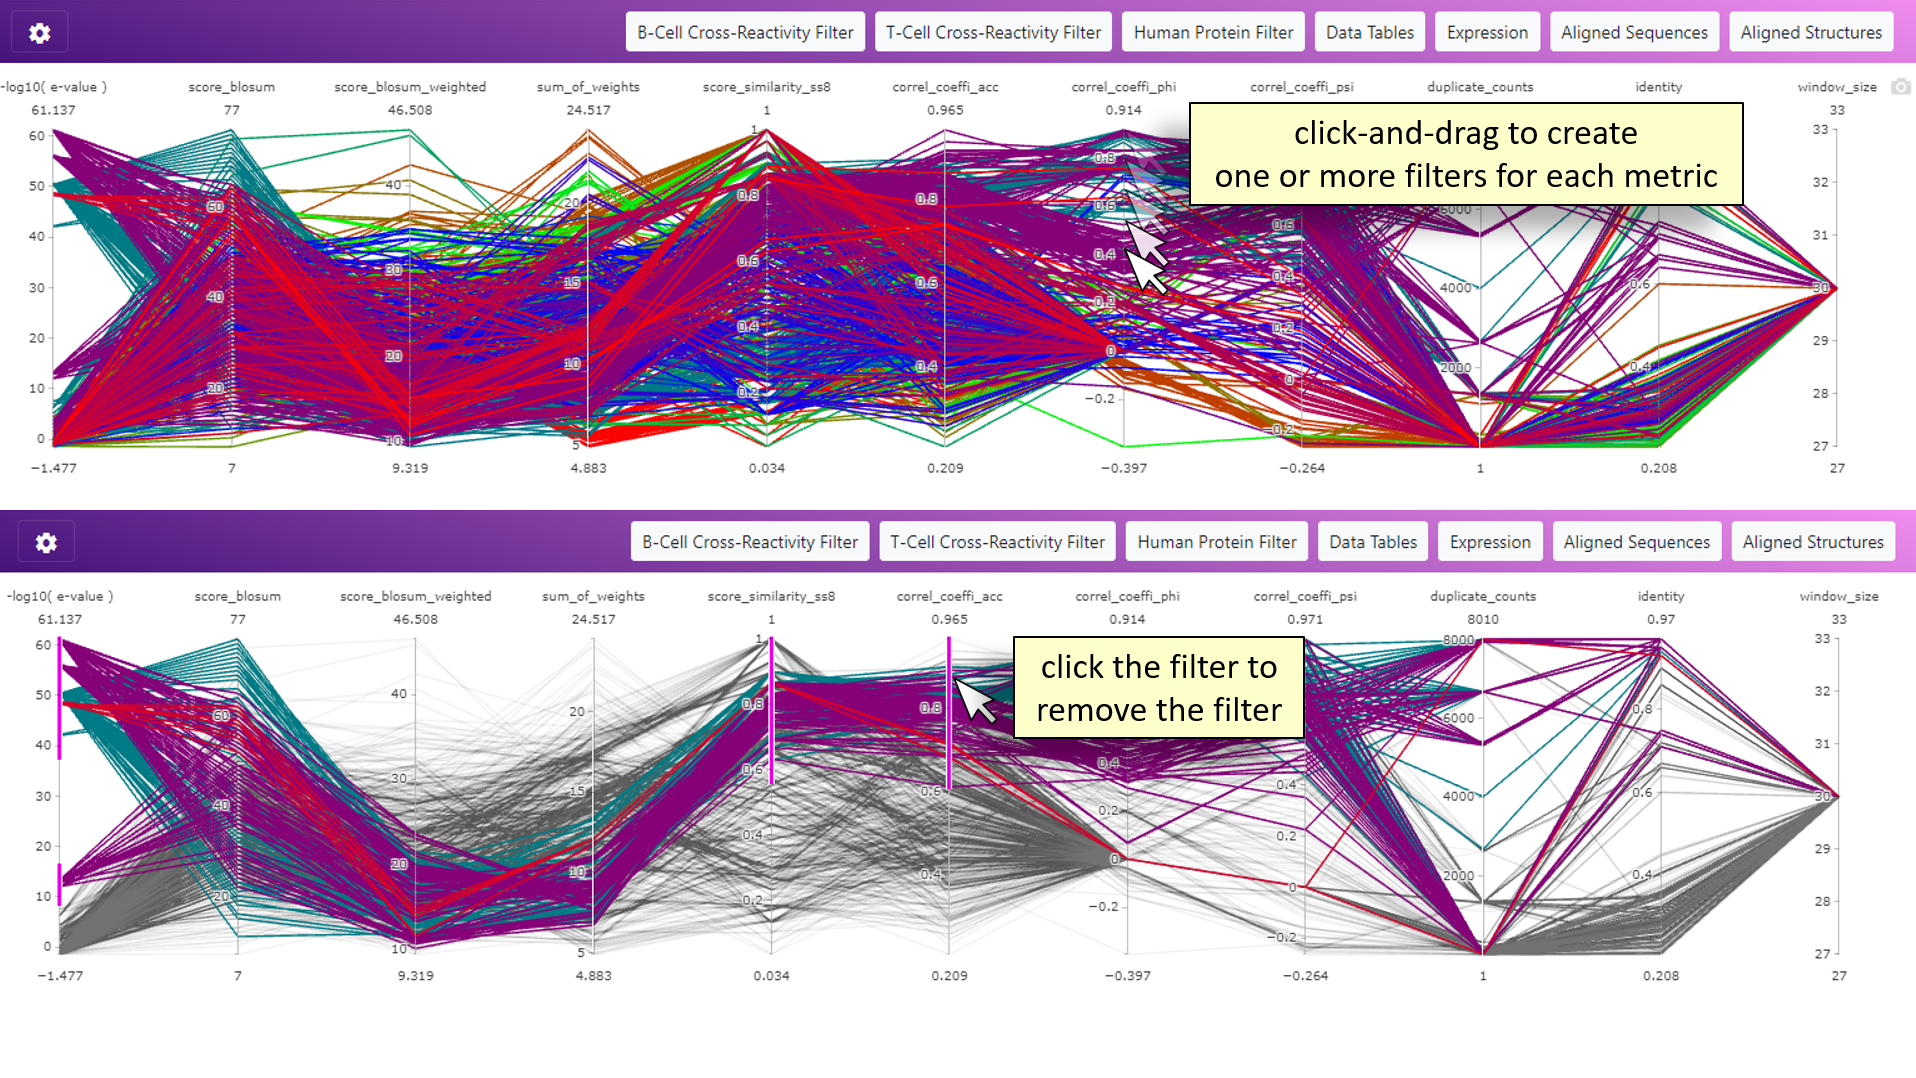
Filter cross-reactive immune epitopes
Multiple filters can be applied.
To remove a filter, click the filter again
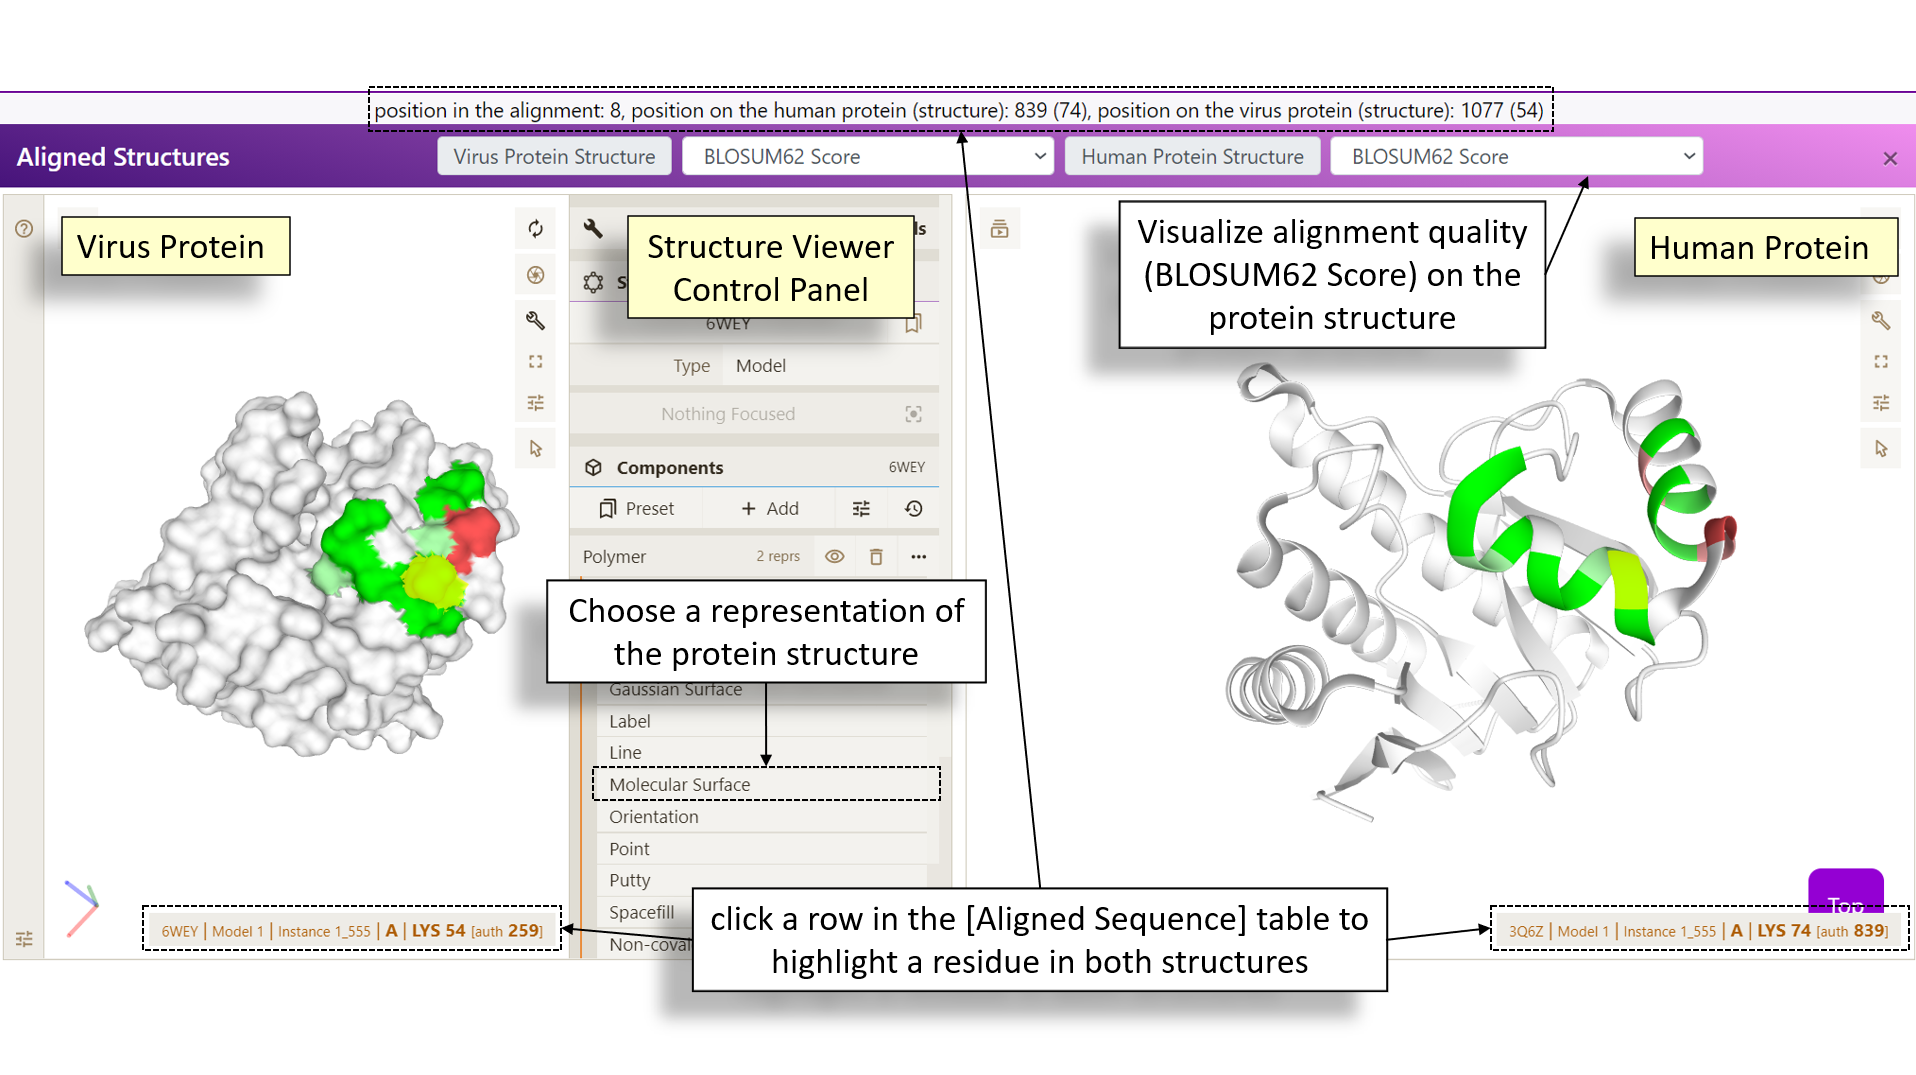
Visualize Aligned Structures
Click a row in the aligned sequence table to highlight a pair of aligned residues on target and query structures
When protein structure is not available, a black screen will be shown